Building a Containerized Quarkus API and a CI/CD Pipeline on AWS EKS/Fargate with CDK
In a recent post, I have demonstrated the benefits of using AWS ECS (Elastic Container Service), with Quarkus and the CDK (Cloud Development Kit), in order to implement an API for the customer management.
In the continuity of this previous post, the current one will try to go a bit further and replace ECS by EKS (Elastic Kubernetes Service) as the environment for running containerized workloads. Additionally, an automated CI/CD pipeline, using AWS CodePipeline and AWS CodeBuild, is provided.
Architecture Overview
The solution that you’re about to look at implements a complete production-ready architecture consisting of:
- Presentation Layer: A Quarkus REST API with OpenAPI/Swagger implementing the customer management solution. This implementation is exactly the same used in the previous project which leverages ECS.
- Application Layer: Business logic with Quarkus Panache for data access
- Data Layer: PostgreSQL (RDS) for persistence, Redis (ElastiCache) for caching
- Container Orchestration: AWS EKS with Fargate for serverless container execution
- Infrastructure as Code: AWS CDK implemented in Quarkus
- CI/CD: Automated pipeline with AWS CodePipeline, CodeBuild, and GitHub integration
Before starting, a couple of explanations are probably required. As you probably know, EKS can be used with two compute engines: EC2 or Fargate. In this example we’ve chosen to use Fargate, as it was also the case of our previous, ECS-based project.
Fargate is a serverless compute engine for containers that provisions and manages the underlying infrastructure and provides automatic scaling. It is designed to make it easy to run containers without having to manage servers or clusters. It’s a great fit for workloads that don’t have long-running connections or require frequent scaling. This project uses Fargate because it needs a continuously running containerized application. Fargate provides the serverless operational model (no server management) while maintaining the traditional container execution model your Quarkus API requires.
The figure below shows the project’s architecture diagram:
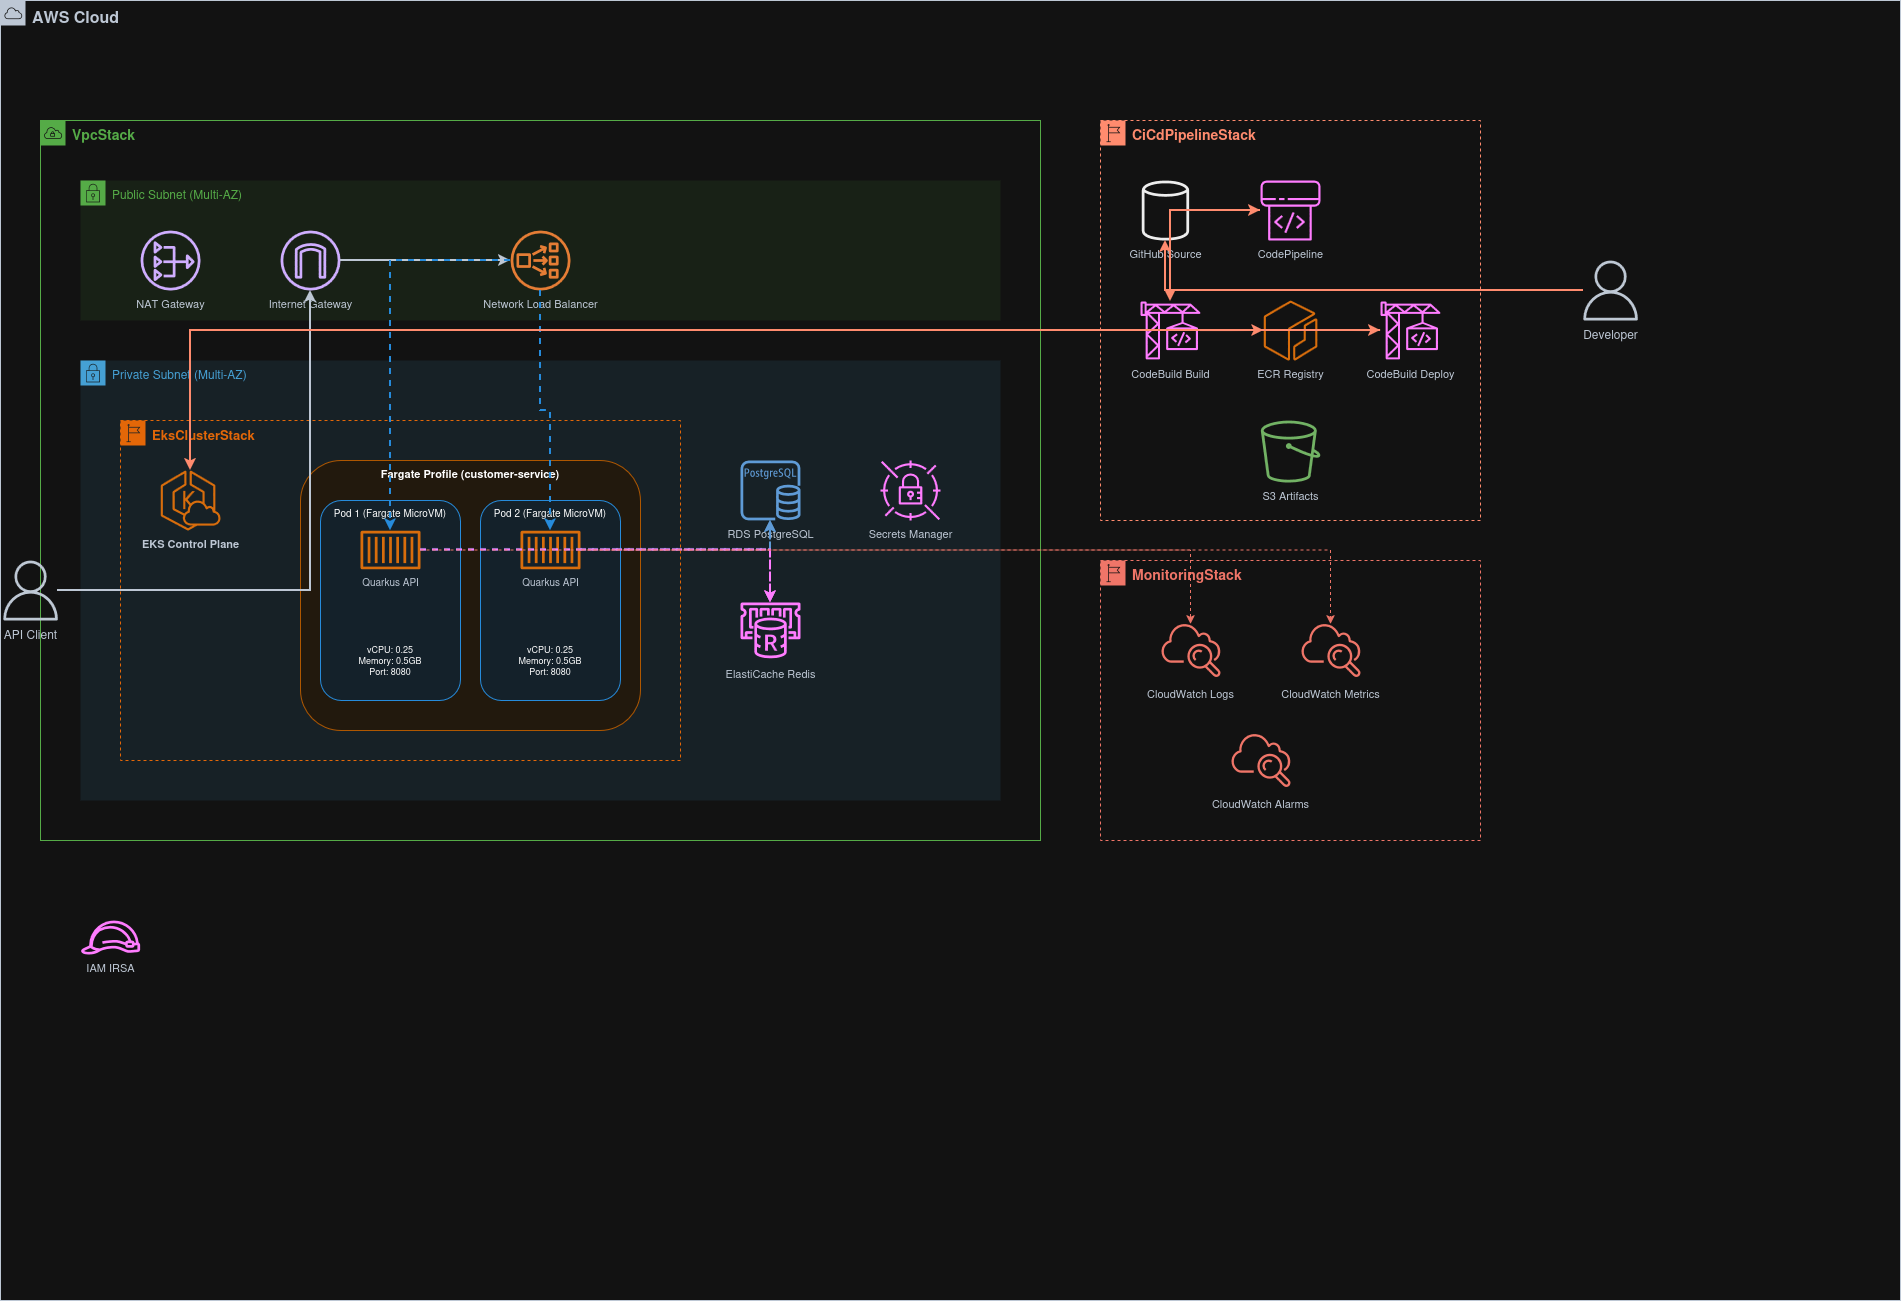
Please notice that, as mentioned above, several layers like: presentation, application and data are the same ones used in
the previous ECS-based example. Hence, we created a new module, called customer-service-eks, in the current Maven multi-module
project. This module is similar to the customer-service-ecs one and they both share the same presentation, application
and data layers, that have been moved in a shared Maven module, called customer-service-cdk-common.
Prerequisites
The following prerequisites are required to run this project:
- Java 21+
- Maven 3.9+
- Docker
- AWS CLI installed and configured with appropriate credentials
- kubectl installed
- AWS CDK CLI installed
- GitHub account with OAuth token stored in AWS Secrets Manager
Project Structure
The project is structured as follows:
customer-service-eks/
├── src/main/java/
│ └── fr/simplex_software/workshop/customer_service_eks/
    │ └── config/
      │ └── CiCdConfig.java # CI/CD Pipeline configuration
    │ ├── CiCdPipelineStack.java # CDK Quarkus CI/CD pipeline infrastructure
    │ ├── CustomerManagementEksApp.java # Quarkus CDK application
    │ ├── CustomerManagementEksMain.java # Quarkus main application
    │ ├── CustomerManagementEksProducer.java # Quarkus CDI producer
    │ ├── EksClusterStack.java # Quarkus CDK EKS cluster infrastructure
    │ ├── MonitoringStack.java # Quarkus CDK monitoring stack infrastructure
    │ ├── VpcStack.java # Quarkus CDK VPC stack infrastructure
├── src/main/resources/
│ ├── buildspecs/
│ │ ├── build-spec.yaml # CodeBuild build specification
│ │ └── deploy-spec.yaml # CodeBuild deploy specification
│ ├── k8s/
│ │ └── customer-service.yaml # Kubernetes manifests
│ ├── scripts/  #several shell scripts
      ...
│ └── application.properties # Configuration
└── src/test/java/
    └── fr/simplex_software/workshop/customer_service_eks/tests/
        └── CustomerServiceE2EIT.java # End-to-end integration tests
Configuration
The project’s configuration is stored in two files:
- the
env.propertiesfile - the
src/main/resources/application.propertiesfile.
The env.properties file contains environment variables that are used by the Maven build process. Its structure is
reproduced below:
CONTAINER_IMAGE_GROUP=nicolasduminil
CONTAINER_IMAGE_NAME=customers-api
CDK_DEFAULT_ACCOUNT=...
CDK_DEFAULT_REGION=eu-west-3
CDK_DEFAULT_USER=nicolas
The properties CONTAINER_IMAGE_GROUP and CONTAINER_IMAGE_NAME are used to build the container image and push it to
the ECR repository. They are used by the JIB Quarkus extension to build the container image. The other properties are
used by the CDK application to deploy the infrastructure and their meanings don’t require any explicit explanation.
The project uses AWS Secrets Manager to store sensitive data like GitHub OAuth token which is used by the CI/CD pipeline.
In order to create the secret, you can use the script setup-github-token.sh reproduced below:
#!/bin/bash
set -e
echo "=== GitHub Token Setup for CI/CD Pipeline ==="

# Read token from stdin or argument
if [ $# -eq 0 ]; then
  if [ -t 0 ]; then
    # No arguments and no piped input
    echo "Usage:"
    echo "  $0 <github-personal-access-token>"
    ...
    exit 1
  else
    # Read from stdin
    GITHUB_TOKEN=$(cat | tr -d '\n\r')
  fi
else
  # Read from argument
  GITHUB_TOKEN=$1
fi

SECRET_NAME="github-oauth-token"

echo "Creating secret in AWS Secrets Manager..."

# Check if secret already exists
if aws secretsmanager describe-secret --secret-id "$SECRET_NAME" >/dev/null 2>&1; then
  echo "Secret already exists. Updating..."
  aws secretsmanager update-secret \
    --secret-id "$SECRET_NAME" \
    --secret-string "$GITHUB_TOKEN"
else
  echo "Creating new secret..."
  aws secretsmanager create-secret \
    --name "$SECRET_NAME" \
    --description "GitHub OAuth token for CI/CD pipeline" \
    --secret-string "$GITHUB_TOKEN"
fi

echo "✅ GitHub token stored successfully!"
echo "You can now run: cdk deploy --all"
This script takes a parameter which could be either an argument or a piped input. The GIT OAuth token should already be acquired from GitHub. In order to do that, proceed as follows:
- Go to: https://github.com/settings/tokens”.
- Click
Generate new token (classic) - Select
repo scope - Copy the generated token.
The othe configuration file, src/main/resources/application.properties, contains the following key properties:
# CI/CD Configuration
cdk.cicd.repository.name=${CONTAINER_IMAGE_GROUP}/${CONTAINER_IMAGE_NAME}
cdk.cicd.github.owner=${CONTAINER_IMAGE_GROUP}
cdk.cicd.github.repo=aws-cdk-quarkus
cdk.cicd.github.token-secret=github-oauth-token

# EKS Configuration
cdk.infrastructure.eks.namespace=customer-service
cdk.infrastructure.eks.cluster-name=customer-service-cluster
cdk.infrastructure.eks.service-account-name=customer-service-account
...
In addition to these configuration files and scripts, the class CiCdConfig uses the MP Config API to define properties
relative to different services and stages of the CI/CD pipeline.
@ConfigMapping(prefix = "cdk.cicd")
public interface CiCdConfig
{
  RepositoryConfig repository();
  GitHubConfig github();
  BuildConfig build();
  PipelineConfig pipeline();
  ...
}
As we can see, CiCdConfig is an interface which contains several sub-interfaces, one for each service or stage. Each
sub-interface defines a set of properties that are used to configure the corresponding service or stage, for exzmple:
...
interface RepositoryConfig
{
  @WithDefault("customer-service")
  String name();
}

interface GitHubConfig
{
  @WithDefault("your-github-user")
  String owner();
  @WithDefault("customer-service")
  String repo();
  @WithDefault("github-token")
  String tokenSecret();
}
...
The CDK Stacks
The IaC code is organized into several CDK stacks, each responsible for a specific aspect of the infrastructure.
The VpcStack
This stack creates the foundational networking infrastructure for the entire solution. It provisions a VPC (Virtual Private
Cloud) with multi-AZ (Availability Zone) support for high availability. The VPC is configured with both public and
private subnets across multiple availability zones, as specified by the maxAzs configuration property (default: 2). The
stack also creates NAT Gateways to enable outbound internet access for resources in private subnets, with the number
controlled by the natGateways property (default: 1). This VPC serves as the network foundation for all other stacks,
including the EKS cluster, RDS database, and ElastiCache Redis instances. The implementation is minimal, as shown below:
vpc = Vpc.Builder.create(this, "EksVpc")
  .maxAzs(config.vpc().maxAzs())           // Default: 2 AZs
  .natGateways(config.vpc().natGateways()) // Default: 1 NAT Gateway
  .build();
The code above uses the software.amazon.awscdk.services.ec2.Vpc CDK construct that automatically creates 6 subnets across
two AZs:
-
2 public subnets (one per AZ) connected to an IGW (Internet Gateway). An IGW is a horizontally scaled, redundant AWS-managed component that allows bidirectional communication between resources in the VPC and the internet. It enables resources with public IP addresses to receive inbound traffic from the internet and send outbound traffic to the internet. In our case, it is used as an NLB (Network Load Balancer) which receives external traffic.
-
2 private subnets with “egress” (one per AZ) connected to a NAT Gateway. A Nat Gateway is a managed service that enables resources in private subnets to initiate outbound connections to the internet (for software updates, API calls, etc.) while preventing unsolicited inbound connections from the internet. In this context, “egress” means outbound-only traffic flow. These 2 private subnets are used for EKS Fargate pods, RDS database and ElastiCache Redis which require all outbound internet access but should not be directly accessible from the internet.
-
2 isolated subnets (one per AZ). These subnets have neither IGW, nor NatGateway and, hence, they don’t have internet connectivity. They are created by default by the
Vpcconstruct but they aren’t used in this project as they are typically dedicated to highly sensitive resources that should never communicate with the internet.
The maxAzs property (default: 2) determines how many availability zones to span for high availability. The natGateways
property (default: 1) controls the number of NAT Gateways - using 1 instead of 2 reduces costs but creates a single point
of failure for outbound internet connectivity.
This VPC serves as the network foundation for all other stacks, including the EKS cluster, RDS database, and ElastiCache Redis instances. We need to mention that any AWS account has a default VPC and that we could have used it here, instead of creating another one. While this alternative would have been much simpler with no additional network cost, having a dedicated VPC is a more “production ready” solution, as it provides better isolation, customized CIDR blocks and more subnets.
The EksClusterStack
This is the core infrastructure stack that creates and configures the EKS cluster with a Fargate compute profile. The stack performs the following several critical operations:
-
creates an EKS cluster (version 1.34) with API authentication mode and public endpoint access. The cluster is deployed in the private subnets of the VPC for enhanced security.
-
adds to the previous created cluster a Fargate profile that targets the
customer-servicenamespace, ensuring all pods in this namespace run on Fargate serverless compute. The profile’s pod execution role is granted CloudWatch Logs permissions for centralized logging. -
sets up a Kubernetes ServiceAccount with IRSA (IAM Roles for Service Accounts), granting the pods secure access to AWS services without embedding credentials. The service account is granted permissions to connect to the RDS database and read secrets from AWS Secrets Manager.
-
programmatically creates Kubernetes manifests including a namespace for workload isolation, a
ConfigMapcontaining database and Redis connection strings, a deployment and a service resource, loaded from the YAML file in theresources/k8sdirectory.
public void initStack() throws IOException
{
  createCluster();
  KubernetesManifest namespace = createNamespace();
  addFargateProfile();
  ServiceAccount serviceAccount = setupServiceAccountWithIAM();
  serviceAccount.getNode().addDependency(namespace);
  KubernetesManifest configMap = addConfigMap();
  configMap.getNode().addDependency(serviceAccount);
  addDeploymentAndService(configMap);
}
The stack establishes dependencies to ensure resources are created in the correct order, with the ConfigMap depending on
the ServiceAccount, and the Deployment depending on the ConfigMap.
@SuppressWarnings("unchecked")
private void addDeploymentAndService(KubernetesManifest configMap) throws IOException
{
  List<Map<String, Object>> manifests = loadYamlManifests("k8s/customer-service.yaml");
  KubernetesManifest previous = configMap;
  for (int i = 0; i < manifests.size(); i++)
  {
    KubernetesManifest current =
      cluster.addManifest("CustomerService-%d".formatted(i), manifests.get(i));
    current.getNode().addDependency(previous);
    previous = current;
  }
}
The code above shows how the file customer-service.yaml, containing the ServiceAccount and the Deployment manifests,
is parsed and the manifests added to the cluster, each one being dependent of the previous one, in order to prevent possible
cyclic dependencies.
The CiCdPipelineStack
This stack implements a complete CI/CD pipeline using AWS native services to automate the build and deployment process. It consists of three stages:
-
Source Stage: integrates with GitHub using a webhook trigger. When code is pushed to the repository, the pipeline automatically retrieves the source code using a GitHub OAuth token stored in AWS Secrets Manager.
-
Build Stage: Uses AWS CodeBuild with a Standard 7.0 Linux image to build the Quarkus application, create a Docker image using the JIB Maven plugin and push the image to Amazon ECR (Elastic Container Registry). The build project has privileged mode enabled for Docker operations and is granted necessary IAM permissions for ECR operations.
-
Deploy Stage: Uses a separate CodeBuild project to update the kubeconfig to access the EKS cluster and apply the updated Kubernetes manifests with the new container image. The deploy project is granted EKS cluster access through IAM role assumption.
The pipeline uses build specifications defined in buildspecs/build-spec.yaml and buildspecs/deploy-spec.yaml, and
stores artifacts in S3 between stages. All configuration is externalized through the CiCdConfig interface using
MicroProfile Config.
  public void initStack()
  {
    IRepository ecrRepo = Repository.fromRepositoryName(this,
      "CustomerServiceRepo", cicdConfig.repository().name());

    Project buildProject = Project.Builder.create(this, "CustomerServiceBuild")
      .source(Source.gitHub(GitHubSourceProps.builder()
      ...
      .build();
    ecrRepo.grantPullPush(buildProject);
    buildProject.addToRolePolicy(PolicyStatement.Builder.create()
      .actions(List.of("ecr:GetAuthorizationToken"))
      .resources(List.of("*"))
      .build());
    buildProject.addToRolePolicy(PolicyStatement.Builder.create()
      .actions(List.of("secretsmanager:GetSecretValue"))
      .resources(List.of("arn:aws:secretsmanager:eu-west-3:" + this.getAccount() + ":secret:redhat-registry-credentials-*"))
      .build());

    Project deployProject = Project.Builder.create(this, "CustomerServiceDeploy")
      ....
      build();
    deployProject.getRole().addManagedPolicy(
      ManagedPolicy.fromAwsManagedPolicyName("AmazonEKSClusterPolicy"));
    eksStack.getCluster().getRole().grantAssumeRole(deployProject.getRole());
    deployProject.addToRolePolicy(PolicyStatement.Builder.create()
      .actions(List.of("eks:DescribeCluster"))
      .resources(List.of(eksStack.getCluster().getClusterArn()))
      .build());

    GitHubSourceAction sourceAction = GitHubSourceAction.Builder.create()
      .actionName(cicdConfig.pipeline().actions().source())
      ...
     .build();

    CodeBuildAction buildAction = CodeBuildAction.Builder.create()
      .actionName(cicdConfig.pipeline().actions().build())
      ...
      .build();

    CodeBuildAction deployAction = CodeBuildAction.Builder.create()
      .actionName(cicdConfig.pipeline().actions().deploy())
      ...
      .build();

    Pipeline pipeline = Pipeline.Builder.create(this, cicdConfig.pipeline().name())
      .build();
    pipeline.addStage(StageOptions.builder()
      .stageName(cicdConfig.pipeline().stages().source())
      .actions(List.of(sourceAction))
      .build());
    pipeline.addStage(StageOptions.builder()
      .stageName(cicdConfig.pipeline().stages().build())
      .actions(List.of(buildAction))
      .build());
    pipeline.addStage(StageOptions.builder()
      .stageName(cicdConfig.pipeline().stages().deploy())
      .actions(List.of(deployAction))
      .build());
  }
The code above create two CodeBuild projects: a build and a deploy one. It assigns to them the required security policies,
like AmazonEKSClusterPolicy and it creates then three actions: one GitHubSourceAction and two CodeBuildAction, one
for the build and the other one for the deploy operation. Last but not least, a Pipeline is created and the three mentioned
actions are added as its stages.
The MonitoringStack
This stack provides observability and monitoring capabilities for the EKS cluster and running applications. It creates
a dedicated CloudWatch log group named /aws/eks/customer-service with a one-week retention policy to collect and store
logs from the EKS pods and cluster components and a CloudWatch dashboard named customer-service-eks that visualizes key
metrics including but not limited to pod CPU utilization from the EKS namespace.
public void initStack()
{
  LogGroup.Builder.create(this, "EksLogGroup")
    .logGroupName("/aws/eks/customer-service")
    .retention(RetentionDays.ONE_WEEK)
    .build();
  Dashboard dashboard = Dashboard.Builder.create(this, "CustomerServiceDashboard")
  .dashboardName("customer-service-eks")
  .build();
  dashboard.addWidgets(
    GraphWidget.Builder.create()
      .title("Pod CPU Utilization")
      .left(List.of(Metric.Builder.create()
        .namespace("AWS/EKS")
        .metricName("pod_cpu_utilization")
        .build()))
      .build()
  );
}
This stack depends on the EksClusterStack to ensure the cluster exists before monitoring resources are created. The monitoring infrastructure enables real-time visibility into cluster health, performance metrics, and troubleshooting capabilities through centralized log aggregation.
Building, deploying and testing
The API to be built a deployed on EKS with Fargate is the same as the one we used previously for the ECS project (see the
customer-service-api module). Other shared artifacts are provided by the customer-service-cdk-common module. Here is
their list:
-
DatabaseConstruct: implements a CDK construct for RDS (Relational Database Service) with PostgreSQL; -
RedisCluster: implements a CDK construct for ElasticCache with Redis; -
RedisClusterProps: gropus together, in one record, several common Redis properties like the cluster ID, the number of nodes, their types, etc. -
DatabaseStack: implements a database CDK stack which includes the previous mentioned PostgreSQL and Redis constructs.
Since these common artifacts are all required in order to build and deploy our stack, they need to be installed in the local Maven repository:
$ cd aws-cdk-quarkus/customer-service-api
$ mvn clean install
$ cd aws-cdk-quarkus/customer-service-cdk-common
$ mvn clean install
The Maven build process of the customer-service-api will run 2 integration tests, one using RESTassured against the
Quarkus embedded web service, the other against a full local containerized infrastructure described by a docker-compose.yaml
file. This has been fully documented and explained in te 1st part of this series.
Now, we can build, deploy and test our new stack. The customer-service-eks module provides two ways to do it:
- in development mode, using minikube;
- in production mode, using AWS infrastructure;
Please notice that localstack, which is a very practical way to test AWS based IaC code without the cloud heavyness and
costs, isn’t an option here, as it doesn’t support EKS, VPC, ECR, etc.
Building, deploying and testing in dev mode
As mentioned, using the dev mode, all our stacks are deployed locally, on minikube. So, this mode requires minikube to be installed and running.
The pom.xml file defines two profiles:
- a dev mode one named
local; - a prod mode one named
e2e;
Here is the dev mode one, which is also the default one:
<profile>
  <id>local</id>
  <activation>
    <activeByDefault>true</activeByDefault>
  </activation>
  <build>
    <plugins>
      <plugin>
        <groupId>org.codehaus.mojo</groupId>
        <artifactId>exec-maven-plugin</artifactId>
        <executions>
          <execution>
            <id>start-minikube</id>
            <phase>pre-integration-test</phase>
            <goals><goal>exec</goal></goals>
            <configuration>
              <executable>minikube</executable>
              <arguments>
                <argument>start</argument>
                <argument>--driver=docker</argument>
              </arguments>
            </configuration>
          </execution>
          <execution>
            <id>deploy-to-minikube</id>
            <phase>pre-integration-test</phase>
            <goals><goal>exec</goal></goals>
            <configuration>
              <executable>bash</executable>
              <arguments>
                <argument>src/main/resources/scripts/deploy-to-minikube.sh</argument>
              </arguments>
            </configuration>
          </execution>
          <execution>
            <id>stop-minikube</id>
            <phase>clean</phase>
            <goals><goal>exec</goal></goals>
            <configuration>
              <executable>minikube</executable>
              <arguments>
                <argument>delete</argument>
              </arguments>
            </configuration>
          </execution>
        </executions>
      </plugin>
    </plugins>
  </build>
</profile>
As you can see, here we’re using the exec-maven-plugin with 3 executions that starts minikube, deploy to minikube and,
respectively, stop minikube. As already mentioned, minikube should be installed in order that the local profile be
effective and, the action with ID start-minikube simply executes the start command.
Once minikube started, the action with ID deploy-to-minikube executes the deploy-to-minikube.sh script, shown below:
#!/bin/bash
set -e

echo ">>> Loading image..."
docker save nicolasduminil/customers-api:1.0-SNAPSHOT | minikube image load -

echo ">>> Creating namespace..."
kubectl create namespace customer-service --dry-run=client -o yaml | kubectl apply -f -

echo ">>> Deploying PostgreSQL and Redis..."
kubectl apply -f src/test/resources/k8s/postgres-redis.yaml

echo ">>> Waiting for database..."
for i in {1..5}; do
  if kubectl get pod -l app=postgres -n customer-service 2>/dev/null | grep -q postgres; then
    break
  fi
  echo "Waiting for postgres pod to be created... ($i/5)"
  sleep 5
done

kubectl wait --for=condition=ready pod -l app=postgres -n customer-service --timeout=60s

echo ">>> Deploying application..."
kubectl apply -f target/kubernetes/minikube.yml

echo ">>> Waiting for application..."
for i in {1..5}; do
  if kubectl get pod -l app.kubernetes.io/name=customer-service-api -n customer-service 2>/dev/null | grep -q customer-service; then
    break
  fi
  echo "Waiting for app pod to be created... ($i/5)"
  sleep 5
done
kubectl wait --for=condition=ready pod -l app.kubernetes.io/name=customer-service-api -n customer-service --timeout=120s

echo ">>> Final status:"
kubectl get all -n customer-service

echo ">>> Starting port-forward..."
kubectl port-forward -n customer-service service/customer-service-api 9090:80 > /dev/null 2>&1 &
echo "Port-forward started (PID: $!)"
sleep 2
The deploy-to-minikube.sh script above is structured for performing several operations. First, the Docker image
nicolasduminil/customers-api:1.0-SNAPSHOT built during the previous step (the shared components) is loaded to minikube
via the command image load. Then, the kubectl tool, which is another prerequisite, is used to create the customized
namespace customer-service and to apply the two manifests: postgresql-manifest.yaml and minikube.yml. Last but not
least, after having waited that all the services be on, the same kubectl is used to start the port-forward process.
At that point we’re able to test our API locally deployed on minikube using the Swagger UI. Fire your preferred browser at http://localhost:9090/q/swagger-ui to take advantage of the 80 to 9090 port-forward. You’re ready to test the API.
Please notice that the minikube.yml manifest file mentioned above is automatically generated by the JIB extension for
Quarkus, while the postgres-redis.yaml was written on the purpose, to define the Kubernetes deployment and service
controllers associated to the PostgreSQL databse and Redis cache. Don’t hesitate to have a look at this file and make sure
you understand what everything is about there.
Building, deploying and testing in prod mode
While the Maven building process is the same and consists in running
$ mvn -Pe2e -DskipTests clean install
deploying is, this time, a much longer and heavier operation as it targets real AWS infrastructure. Look at the e2e
Maven profile below:
<profile>
  <id>e2e</id>
  <build>
    <plugins>
      <plugin>
        <groupId>org.codehaus.mojo</groupId>
        <artifactId>exec-maven-plugin</artifactId>
        <executions>
          <execution>
            <id>deploy-to-aws</id>
            <phase>pre-integration-test</phase>
            <goals>
              <goal>exec</goal>
            </goals>
            <configuration>
              <executable>bash</executable>
              <arguments>
                <argument>./src/main/resources/scripts/deploy-to-aws.sh</argument>
              </arguments>
              <workingDirectory>${project.basedir}</workingDirectory>
              <environmentVariables>
                <CDK_DEFAULT_ACCOUNT>${CDK_DEFAULT_ACCOUNT}</CDK_DEFAULT_ACCOUNT>
                <CDK_DEFAULT_REGION>${CDK_DEFAULT_REGION}</CDK_DEFAULT_REGION>
                <CDK_DEFAULT_USER>${CDK_DEFAULT_USER}</CDK_DEFAULT_USER>
                <CONTAINER_IMAGE_GROUP>${CONTAINER_IMAGE_GROUP}</CONTAINER_IMAGE_GROUP>
                <CONTAINER_IMAGE_NAME>${CONTAINER_IMAGE_NAME}</CONTAINER_IMAGE_NAME>
                <CONTAINER_PORT>${CONTAINER_PORT}</CONTAINER_PORT>
              </environmentVariables>
            </configuration>
          </execution>
        </executions>
      </plugin>
    </plugins>
  </build>
</profile>
What this profile is doing is simply running the deploy-to-aws.sh script via the exec-maven-plugin.
#!/bin/bash
set -e
...
../customer-service-cdk-common/src/main/resources/scripts/deploy-ecr.sh

echo ">>> Updating kubeconfig..."
aws eks update-kubeconfig --region $CDK_DEFAULT_REGION --name customer-service-cluster

echo ">>> Checking EKS access..."
USER_ARN=$(aws sts get-caller-identity --query 'Arn' --output text)
grant_eks_access "$USER_ARN" "current user"

echo ">>> Granting EKS access to CodeBuild deploy role..."
DEPLOY_ROLE_ARN=$(aws iam list-roles --query 'Roles[?contains(RoleName, `CustomerServiceDeployRole`)].Arn' --output text --region $CDK_DEFAULT_REGION)
if [ -n "$DEPLOY_ROLE_ARN" ]; then
  grant_eks_access "$DEPLOY_ROLE_ARN" "deploy role"
else
  echo ">>> Deploy role not found (pipeline not deployed yet)"
fi

echo ">>> Retrieving database password from Secrets Manager..."
SECRET_ARN=$(jq -r '.DatabaseStack.DatabaseSecretArn' cdk-outputs.json)
DB_PASSWORD=$(aws secretsmanager get-secret-value --secret-id $SECRET_ARN --region $CDK_DEFAULT_REGION --query SecretString --output text | jq -r .password)

echo ">>> Creating Kubernetes secret with database password..."
kubectl create secret generic db-credentials \
  --from-literal=QUARKUS_DATASOURCE_PASSWORD="$DB_PASSWORD" \
  -n customer-service --dry-run=client -o yaml | kubectl apply -f -

echo ">>> Waiting for pods to be ready..."
kubectl wait --for=condition=ready pod -l app=customer-service-api -n customer-service --timeout=300s || true

echo ">>> Deployment complete!"
echo ">>> To access the API locally, run:"
echo ">>>   ./src/main/resources/scripts/test-api.sh"
echo ">>> Then test with:"
echo ">>>   curl http://localhost:8080/q/health"
The script above contains several distinct sections. First, it runs the shared script deploy-ecr.sh, present in the
customer-service-cdk-common module, which deploys to ECR (Elastic Container Registry) the image
nicoladuminil/customer-service-api::1.0-SNAPSHOT, built previously, before running the cdk deploy command, which
deploys to AWS all the CloudFormation stacks. This process is very complex and long and, depending on your network speed
, it may take 15 - 20 minutes.
Then the script updates the .kube/config file with the EKS cluster required parameters, such that it could be handled
further by kubectl. Next it grants the AmazonEKSClusterAdminPolicy to the current user and the deployer user,
identified by the CustomerServiceDeployRole. Then it gets the AWS secret containing the PostgreSQL database user
password and creates a Kubernetes secret to be used by the associated pod. Once that all the pods started and are healthy,
the script displays instructions of how to proceed further for testing purposes.
Several tests are available, once that the deployment process has succeeded. First, an e2e test, named CustomerServiceE2EIT
can be run as folowws:
$ mvn -Pe2e failsafe:integration-test
Here is the listing:
public class CustomerServiceE2EIT extends AbstractCustomerServiceE2E
{
  private static Process portForwardProcess;

  @BeforeAll
  static void setup() throws Exception
  {
    startPortForward();
    configureEndpoint("localhost:8080");
    waitForServiceReady();
  }

  @AfterAll
  static void teardown()
  {
    if (portForwardProcess != null && portForwardProcess.isAlive())
    {
      portForwardProcess.destroy();
      System.out.println(">>> Port-forward stopped");
    }
  }

  private static void startPortForward() throws Exception
  {
    System.out.println(">>> Waiting for deployment to be ready...");
    Process waitProcess = new ProcessBuilder(
      "kubectl", "wait", "--for=condition=Available",
      "deployment/customer-service-api-deployment",
      "-n", "customer-service",
      "--timeout=300s"
      ).start();

    if (waitProcess.waitFor() != 0)
      throw new RuntimeException("### Deployment not available");

    System.out.println(">>> Starting port-forward...");
    portForwardProcess = new ProcessBuilder(
      "kubectl", "port-forward",
      "deployment/customer-service-api-deployment",
      "8080:8080",
      "-n", "customer-service"
    ).start();

    Thread.sleep(3000);
    System.out.println(">>> Port-forward established on localhost:8080");
  }
}
As you can see, the test extends the AbstractCustomerServiceE2E present in the shared module customer-service-cdk-common.
This abstract class defines the test case to be run as they are the same whatever the cloud runtime is, be it ECS or EKS.
The only operation specific to the cloud runtime is the port-forward process start, implemented by the method
startPortForward().
Of course, you can test your API using the Swagger UI, as you did before, in dev mode. The only thing you need to do is
to start the port-forward and, for this, the script test-api.sh, here below, comes very handy:
#!/bin/bash
echo ">>> Starting port-forward to access API locally..."
echo ">>> API will be available at http://localhost:8080"

nohup kubectl port-forward svc/customer-service-api-service -n customer-service 8080:80 2>/dev/null &
Then fire your preferred browser, as usual, at http://localhost:8080/q/swagger-ui. Other test scripts, like
load-distribution-demo.sh, perf-demo.sh, pods-monitoring.sh, scaling-demo.sh, are available as well,
just run them.
Once you finished testing, please cancel the port-forwarding by running:
$ pkill -f "kubectl port-forward"
And don’t forget to clean up your cloud by running:
$ cd aws-cdk-quarkus/customer-service/eks
$ cdk destroy --all --force
A script named destroy-all.sh is also available for a more atomic destruction.
Troubleshooting in prod mode
Working in prod mode, i.e. running the API and the associated tests against real AWS infrastructure, is challenging. The environment is very complex and, at any step, dozens of issues might prevent things to happen as expected. Hence, the necessity to be able to visualize the cloud infrastructure current status and the most recent events.
While the AWS Console is a very usefull tool, designed on the purpose to optimize the visualization of the cloud
infrastructure status, using the kubectl utility represents the Kubernetes most traditional way to check the cluster
health. Also, AWS CLI is able to perform all the AWS Console functions, in a less intuitive way, which requires a deep
knowledge, but which might be more practical, less repetitive as scriptable, and less error-prone.Accordingly, a kubectl
and AWS CLI commands breviary could be helpful in order to fix issues.
Verifying the EKS cluster deployment
The following kubectl commands can be used to verify the EKS cluster deployment:
- Check the cluster:
$ kubectl get nodes -n customer-service
- Check the pods:
$ kubectl get pods -n customer-service
- Check the services:
kubectl get services -n customer-service
- View all logs from pods:
$ kubectl logs -f -l app=customer-service-api -n customer-service
- Check rollout status:
$ kubectl rollout status deployment/customer-service-api-deployment -n customer-service
- View deployment details:
$ kubectl describe deployment customer-service-api-deployment -n customer-service
- Verify ECR repository exists:
$ aws ecr describe-repositories --region eu-west-3
- Check IAM permissions
$ aws iam get-role-policy --role-name <build-role-name> --policy-name <policy-name>
- Verify EKS cluster access
$ aws eks describe-cluster --name customer-service-cluster --region eu-west-3
- Check pod events
$ kubectl describe pod <pod-name> -n customer-service
- Verify RDS endpoint
$ aws rds describe-db-instances --region eu-west-3
Verifying th CI/CD Pipeline deployment
- Get the webhook URL:
aws codepipeline list-webhooks --region eu-west-3
- Check pipeline execution status:
$ PIPELINE=$(aws codepipeline list-pipelines --region eu-west-3 --query 'pipelines[?starts_with(name, `CiCdPipelineStack`)].name' --output text)
$ aws codepipeline get-pipeline-state --name $PIPELINE --region eu-west-3
- List recent pipeline executions:
$ aws codepipeline list-pipeline-executions --pipeline-name $PIPELINE --region eu-west-3 --max-items 5
- Get CodeBuild project names:
$ aws codebuild list-projects --region eu-west-3 --query 'projects[?contains(@, `CustomerService`)]'
- Check build project status:
$ BUILD_PROJECT=$(aws codebuild list-projects --region eu-west-3 --query 'projects[?contains(@, `CustomerServiceBuild`)]' --output text)
$ aws codebuild batch-get-projects --names $BUILD_PROJECT --region eu-west-3
- List recent builds:
$ aws codebuild list-builds-for-project --project-name $BUILD_PROJECT --region eu-west-3 --max-items 5
- Get detailed build information:
$ BUILD_ID=$(aws codebuild list-builds-for-project --project-name $BUILD_PROJECT --region eu-west-3 --query 'ids[0]' --output text)
$ aws codebuild batch-get-builds --ids $BUILD_ID --region eu-west-3
- View build logs:
$ aws logs tail /aws/codebuild/$BUILD_PROJECT --since 30m --follow --region eu-west-3
- Check deploy project status:
$ DEPLOY_PROJECT=$(aws codebuild list-projects --region eu-west-3 --query 'projects[?contains(@, `CustomerServiceDeploy`)]' --output text)
$ aws codebuild list-builds-for-project --project-name $DEPLOY_PROJECT --region eu-west-3 --max-items 5
- View deploy logs:
$ aws logs tail /aws/codebuild/$DEPLOY_PROJECT --since 30m --follow --region eu-west-3
- Verify GitHub OAuth token secret:
$ aws secretsmanager describe-secret --secret-id github-oauth-token --region eu-west-3
- Check CodeBuild service role permissions:
$ BUILD_ROLE=$(aws iam list-roles --query 'Roles[?contains(RoleName, `CustomerServiceBuildRole`)].RoleName' --output text)
$ aws iam list-attached-role-policies --role-name $BUILD_ROLE
$ aws iam list-role-policies --role-name $BUILD_ROLE
- Check deploy role EKS access:
$ DEPLOY_ROLE_ARN=$(aws iam list-roles --query 'Roles[?contains(RoleName, `CustomerServiceDeployRole`)].Arn' --output text)
$ aws eks list-access-entries --cluster-name customer-service-cluster --region eu-west-3
Verifying the Monitor Pipeline
- List the existent pipeleines
$ aws codepipeline list-pipelines --region eu-west-3 --query 'pipelines[?starts_with(name, `CiCdPipelineStack`)].name' --output text
CiCdPipelineStack-CustomerServicePipelineB3195C39-t9UMJeMAQlDN
- Get the monitoring pipeline status
$ aws codepipeline get-pipeline --name $PIPELINE --region eu-west-3 --query 'pipeline.stages[?name==`Build`].actions[0].configuration.ProjectName' --output text
CustomerServiceBuild0A9B7C3-YIk2RDA0JP1B
- View the monitoring pipeline log file
aws logs tail /aws/codebuild/CustomerServiceBuild0A9B7C3-YIk2RDA0JP1B --since 30m --follow --region eu-west-3
Conclusions
This project demonstrates a production-ready approach to deploying containerized Quarkus applications on AWS EKS with Fargate, leveraging Infrastructure as Code through the AWS CDK. By combining Kubernetes orchestration with serverless compute, we achieve operational simplicity without sacrificing the flexibility and portability that Kubernetes provides.
The automated CI/CD pipeline ensures consistent deployments from code commit to production, while the comprehensive monitoring and troubleshooting capabilities enable reliable operations at scale. Whether you’re migrating from ECS to EKS or building cloud-native applications from scratch, this architecture provides a solid foundation for modern microservices deployment on AWS.